






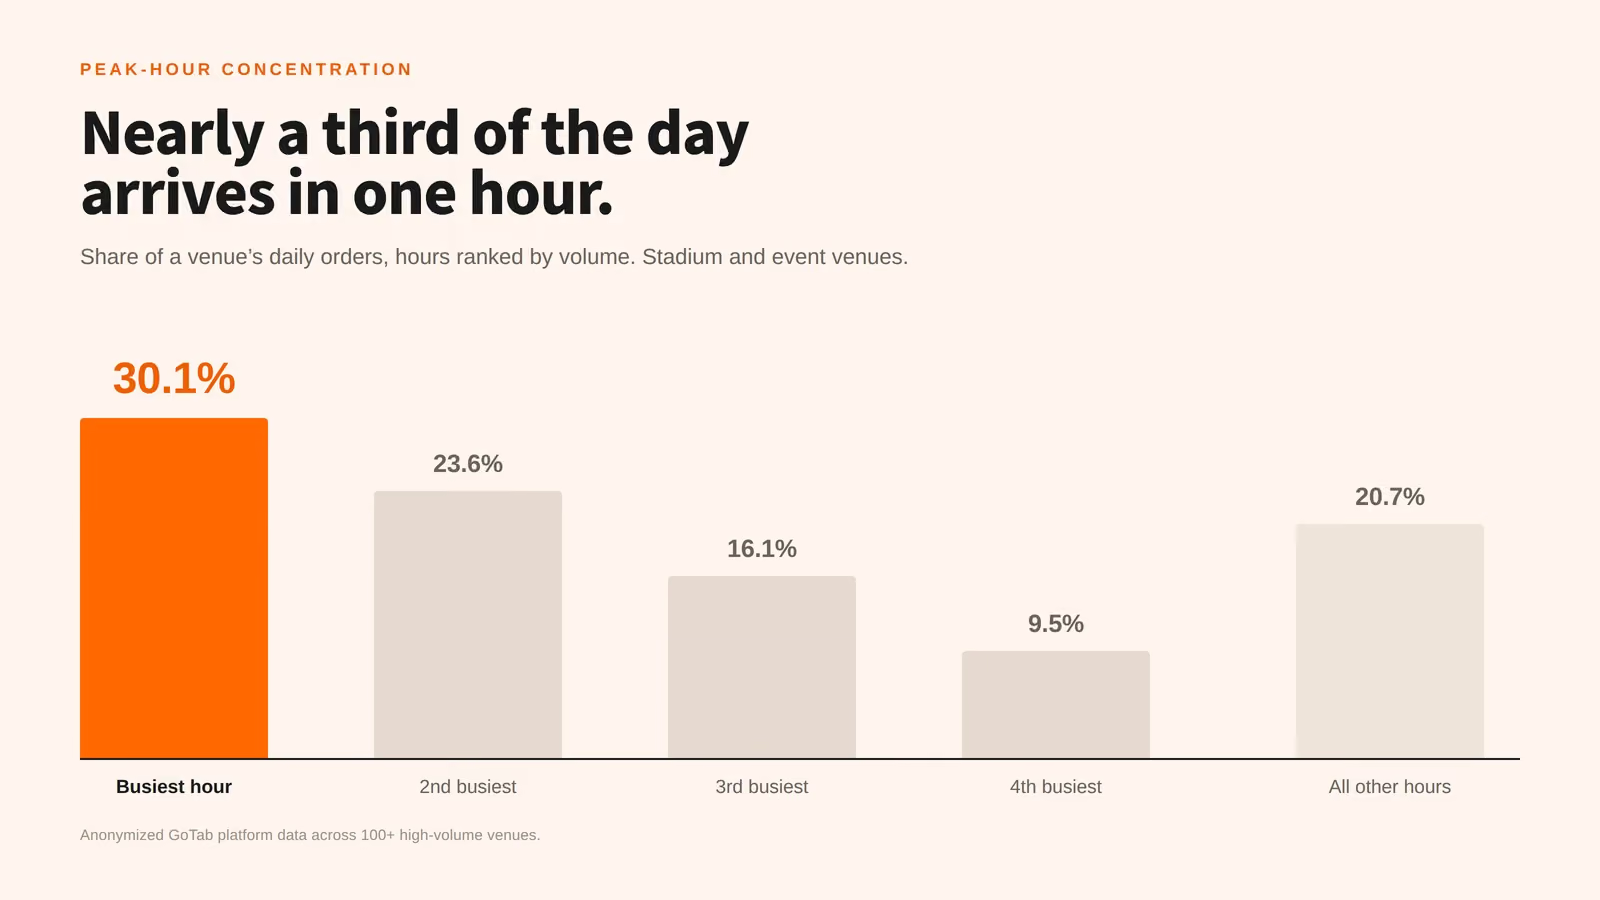
Short answer: per-cap is an output, not a lever. You raise it by raising the number of orders a venue can physically take during the hour everyone wants to buy — and at stadium and event venues, roughly 30% of a day's orders arrive in that single hour. Adding staff stops helping before you reach the ceiling, because the constraint is order intake, not kitchen capacity.
The figures in this piece come from anonymized GoTab platform data across 100+ stadium, event and family-entertainment venues over a recent four-week period.
Per-Cap Is An Output, Not A Lever
Per-capita F&B spend is total food and beverage revenue divided by attendance. You cannot pull it directly. You can only pull the three inputs underneath it:
- Conversion — the share of guests who buy anything at all
- Average transaction value — what each buying guest spends per order
- Orders per buying guest — how many times they come back
Most venues try to move the middle one, because menu engineering and upsell prompts are the easiest things to change. The middle one is also the one with the least headroom. The other two are governed by the same physical constraint, and it is the one operators describe over and over.
The Constraint Operators Actually Name
Ask a high-volume operator what limits them and almost nobody says the kitchen. A four-site family entertainment group running 41 terminals put it as precisely as it can be put: "Sometimes… in our main area, I feel as if we're limited by how fast we can take in orders."
A 100-acre farm venue with 21 food outlets and 10,000 to 15,000 guests a day said the same thing about their peak season: "With these larger crowds, in the fall, I think that's our biggest thing is speed of service and clearing those lines."
And a multi-venue operator sited next to an arena described what happens when demand arrives all at once rather than steadily: "Because of our proximity to the arena, there are a handful of instances where we just get hit like a flash mob and we'll get 150 people all arrive at one moment trying to put in an order… we ended up with three hour ticket times. It was a wall of tickets. It was the most unreal thing I'd ever seen."
Three hours of ticket time is not a kitchen that is too slow. It is a queue that was allowed to form faster than it could be cleared.
How Concentrated Is The Peak, Really?
This is the number that reframes the problem. Across busy operating days:
| Measure | Stadium & event venues | Family entertainment |
|---|---|---|
| Share of the day's orders in the single busiest hour | 30.1% | 22.5% |
| Typical peak-hour orders | 66 | 44 |
| Peak-hour orders on their biggest days | 143 | 141 |
| Busiest single hour recorded | 201 | 509 |
| Hours of ordering in a typical operating day | 9.0 | 12.7 |
A stadium venue's day is nine hours long and a third of it happens in sixty minutes. That is not a staffing problem you can solve by spreading people evenly across the shift, and it is not a demand problem — the demand is there, arriving on schedule, at the interval break or the gates opening.
The gap between those two peak figures is the interesting part. Venues that typically clear 66 orders in their busiest hour handle 143 on their biggest days. Whatever their real ceiling is, it sits above their ordinary peak — which means on a normal event they are not capacity-constrained at all, and on a big one they are.
The Kitchen Is Not Where It Breaks
This is the finding that surprised us, and it is worth stating plainly because it contradicts the intuitive story.
Looking at kitchen prep time — the gap between an order reaching the kitchen and being marked ready — against how busy the hour was:
| Orders in the hour | Average prep time | At the slow end |
|---|---|---|
| Under 10 | 14m 07s | 28m 03s |
| 10–24 | 11m 10s | 17m 53s |
| 25–49 | 11m 57s | 19m 23s |
| 50–99 | 11m 31s | 20m 01s |
| 100 or more | 6m 49s | 14m 37s |
Prep time does not climb as volume climbs. It falls. The busiest hours are the fastest hours — roughly half the prep time of the quietest ones.
Two things explain most of that, and neither is "kitchens work better under pressure." The busiest hours are fully staffed by design, with the line set and everyone in position. And the quiet hours carry the long tail — the single ticket that sat while someone was on a break, the order left open until close. This is what venues actually do rather than a controlled test, so read it as a ceiling that has not been hit rather than proof that it cannot be.
But the practical conclusion holds either way. If prep time is flat or falling at 100+ orders an hour, the kitchen is not what caps your peak. The number of places a guest can place an order is.
The Second-Drink Problem
A queue does not only cost you the sale someone abandons. It costs you the sale they never considered.
A brewery running a taproom, a beer garden and a music venue described it exactly: "Our service lines get quite long during certain points. And I think that prevents people from getting that second beer."
This is the input with the most headroom, and it is the hardest one to see in a report, because the missing round leaves no trace. A guest who buys once and would have bought twice looks identical to a guest who only ever wanted one.
The arithmetic is simple enough to run on your own numbers. Take your attendance, your conversion rate and your average transaction value. Then ask what a ten-percentage-point improvement in orders-per-buying-guest is worth against what it costs to add the order points that would enable it. At most venues the answer is not close, because order points are cheap relative to a beer.
Where The Real Headroom Is
Across the same venues, the share of orders placed by the guest rather than entered by a staff member:
| Venue type | Guest-placed orders | Avg guest-placed order | Avg staff-placed order |
|---|---|---|---|
| Stadium & event venues | 11.1% | $10.62 | $16.62 |
| Family entertainment | 28.8% | $14.91 | $54.26 |
Read that second and third column together, because taken alone the middle one gets misused. Guest-placed orders are smaller, and at family entertainment venues dramatically so — a staff-placed order there is often a whole party or a package, while a guest-placed order is one person adding a round from their seat.
So self-ordering does not raise your average ticket. That is not the argument for it. The argument is that a guest-placed order consumes none of your order-intake capacity during the hour when that capacity is the binding constraint — and it makes the second round possible for someone who would not have queued for it.
At 11.1%, stadium and event venues have barely started. Nearly nine in ten orders still route through a staff member standing at a fixed point of sale, which is precisely the resource that runs out at the interval.
Order Points Per Thousand Guests
The planning number most venues want does not exist as a published benchmark, because it depends on what an order point costs you. A fixed stand, a kiosk, a handheld and a QR code all add intake capacity at wildly different prices and wildly different footprints.
A more useful way to size it: work backwards from your peak. If a third of your day lands in one hour, and you know your attendance and your target conversion, you know how many orders that hour has to absorb. Divide by the throughput of one order point and you have your requirement.
- Fixed stand. Highest throughput per point, highest cost, fixed location — capacity sits where you built it, not where the crowd is.
- Kiosk. Good throughput, no labour per transaction, still fixed in place.
- Handheld. Moves capacity to the queue instead of moving the queue to capacity. Costs a staff member per unit.
- QR ordering. Effectively unlimited intake capacity at near-zero marginal cost per order point, and the lowest conversion of the four — it needs signage, connectivity and a reason to use it.
The venues that clear their peaks do not pick one. They put fixed capacity where demand is predictable and mobile capacity where it is not, and they use guest-placed ordering to absorb the spike that no amount of fixed capacity would justify building for.
What To Do With This
Three things worth measuring at your own venue before spending anything:
- What share of your day lands in your busiest hour? If it is near 30%, you are a peak-capacity business, and average-hour staffing math will mislead you.
- Does your prep time actually degrade at peak? If it does not, stop adding kitchen capacity and add order points.
- What share of your orders are guest-placed today? If it is near 11%, that is your headroom, and it is the cheapest capacity you can add.
Per-cap will move when the queue stops deciding how much your guests are allowed to spend.
GoTab runs fixed points of sale, kiosks, handhelds and guest-placed QR ordering on one platform, so intake capacity can move to wherever the queue is. See how GoTab handles stadiums and event venues, or read more about self-ordering kiosks.